Precision
For all the predicted positives, what percentage of it is actually correct.
P = TP / (TP + FP)
Note: TP + FP = Total predicted positives
Recall
For all the positives in the GT, what percentage of it is predicted correctly.
R = TP / (TP + FN)
Note: TP + FN = Total actual positives
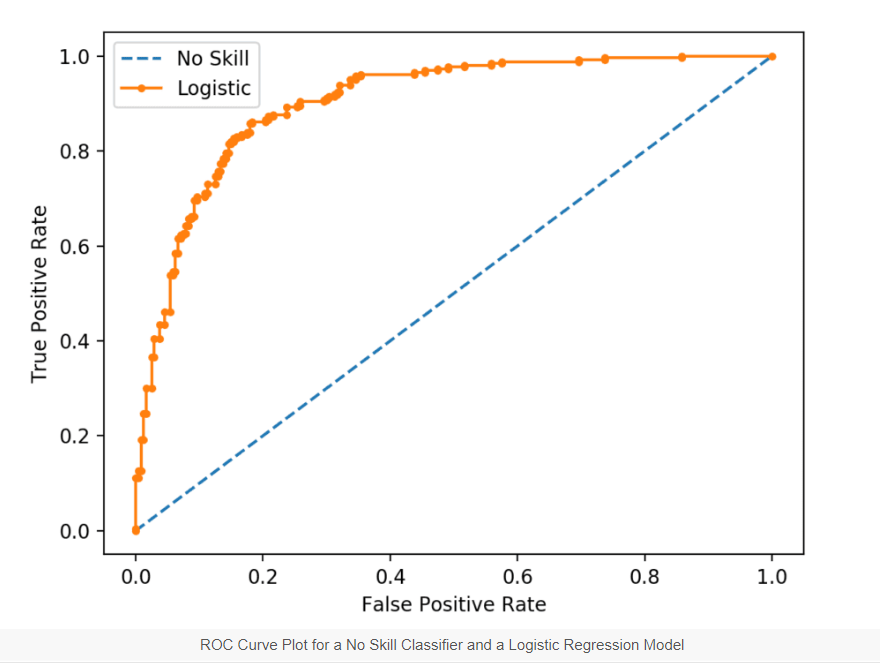
ROC Curve
FPR = FP / (FP + TN)
TPR = TP / (TP + FN) –> Also called as recall
Interpreting ROC:
On x axis -> Lower values is less FP, high TN
On y axis -> Higher value is high TP, low FN
So, the curve shown in the above image, gives the highest area under curve. It indicates a very good skill of the model.
How to plot a ROC curve:
- Set a threshold for the probability for an outcome to be positive sample THRESH_PROB.
- Calculate the FPR and TPR.
- Plot a data point in the graph.
- Repeat step 1 for a different threshold.
PR Curve

How to plot a PR curve:
- Set a threshold for the probability for an outcome to be positive sample THRESH_PROB.
- Calculate the Precision and Recall
- Plot a data point in the graph.
- Repeat step 1 for a different threshold.
PR vs ROC
PR and ROC has one common metric i.e. Recall. So when recall is constant (when FN of two classifiers are same), then it makes sense to look into false positives.
- FPR will be very small in this case as TN is normally high for object detection algorithms. So it does not give any info about FP.
- A better way to analyze FP is to calculate the precision and it can be visualized in the PR curve.
If there is a class imblance, use PR CURVE.
References
- https://cosmiccoding.com.au/tutorials/pr_vs_roc_curves/
- https://machinelearningmastery.com/roc-curves-and-precision-recall-curves-for-classification-in-python/
