Contents
Terminology
Sample – A subset of a population
Inference – It explains the relationship between the input X and output Y.
Ex – Proportation, inversely proportional etc
Prediction – It is the outcome of the model and does not explain the relationship.
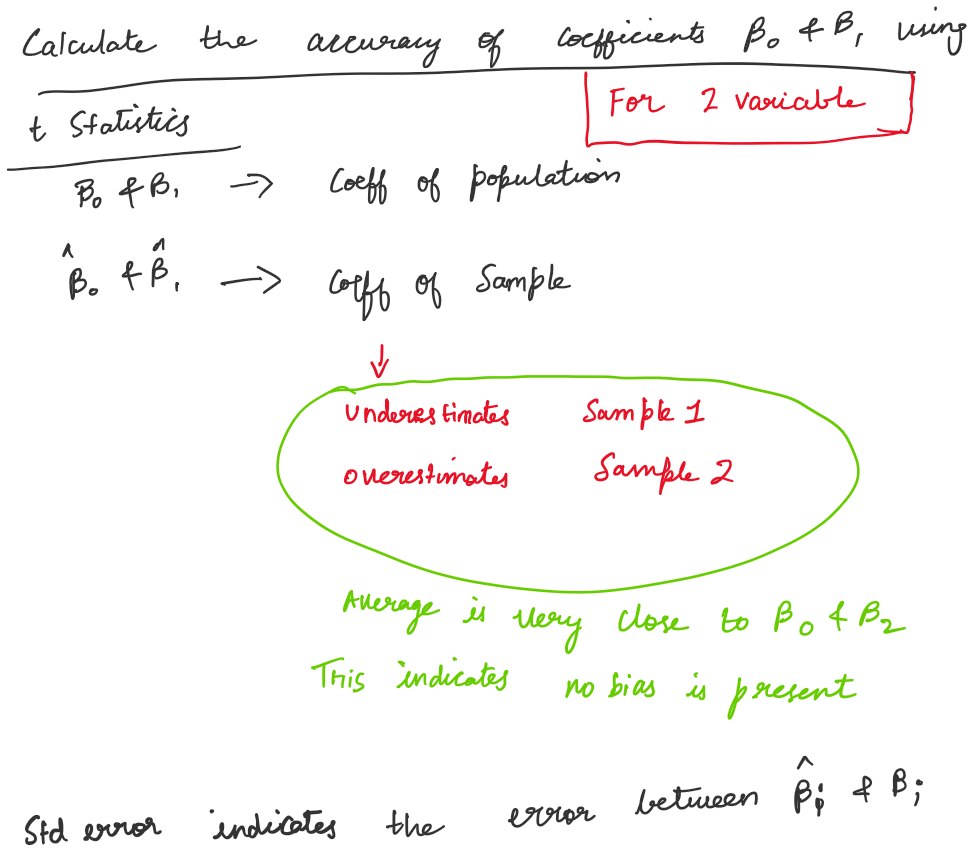
Standard error – It is a measure of the similarity between the sample and population.
It is very similar to standard deviation. Standard deviation is calculated for a single sample whereas standard error is calculated using multiple samples of a population.
P value – It is the probability of the an event occurring randomly. If p-value of a coefficient is very low, then null hypothesis is false (and vice versa).
Model interpretability vs Accuracy

Linear models such as linear regression are restricted in the form/shape of a decision boundary (ex – straight line, plane). However they are good at explaining the relationship between X and Y. For non linear data, the accuracy of linear models fail, however the interpretability is still preserved.
For non linear model such as boosting, deep learning networks the accuracy is high as the decision boundary is not restricted, i.e. it can be curve or can take any shape based on the feature. However it is difficult to interpret the relationship making it hard to understand the response of the model in case of failures.
Interpretability of Linear Regression
t statistics -for single coefficient
f statistics – for multiple coefficient